
Using the Debug Diagnostic 1.1 Tool to Troubleshoot Application Crashes
Posted by William Diaz on July 18, 2010
In cases where the post-mortem default debugger, e.g. Dr Watson in XP, fails to capture a user mode dump of a crashing process or service, you need to be a bit proactive and attach to the crashing application. You can do this a number of ways, such as using ADPlus or WinDbg from the Windows Debugging Tools, but this may not be practical on a user’s workstation (big foot print, invasive, process does not run transparently). Also, the crash may be too random to recreate quickly or at will.
In these circumstances, Debug Diagnostics comes in very useful. It has a small foot print, runs as a Windows service, can be quickly setup via rules, and the GUI can then be closed and left to wait for the target process to crash. Afterwards, a dump can be retrieved from the system remotely, and impact on the user remains minimal. Additionally, Debug Diagnostics can also analyze the dump created and find a solution on-line.
Outlined is a basic setup, attaching Debug Diagnostics to crashing instances of Internet Explorer. In the example here, I am creating a crash rule for a specific process:
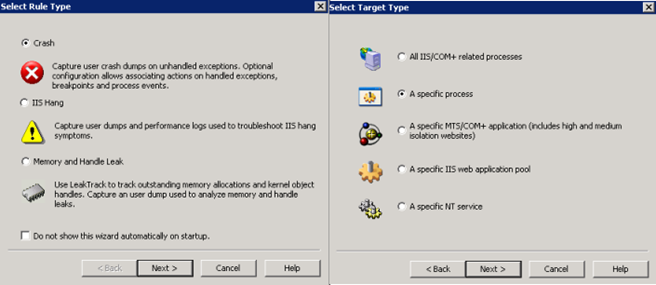
I will be using iexplore.exe. If the process is not started it will not be available from the list so just type in the process name, which would come in handy where the process crashes upon opening. Since we are creating a basic rule, stick with the defaults. 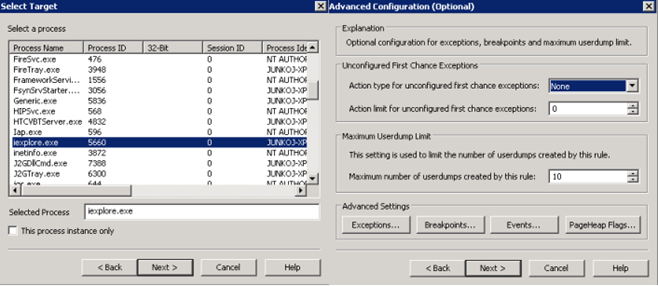
Name the rule name or leave the default. Also note that the .dmp file is created by default in C:\Program Files\DebugDiag\Logs\RuleName. The default settings are to store up to 10 dumps in this location. Once the rule is completed you have the option of running it now or later. 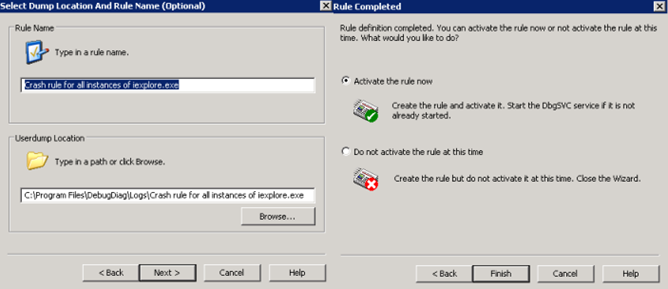
Debug Diagnostics already points to the Microsoft Symbol server but you may want to modify the search path to include local symbol store as well. This can be done from the Tools > Options and Settings menu. In my case I already have a cache of symbols but also includ the Microsoft symbol server: svc*c:\windows\symbols*http://msdl.microsoft.com/download/symbols. 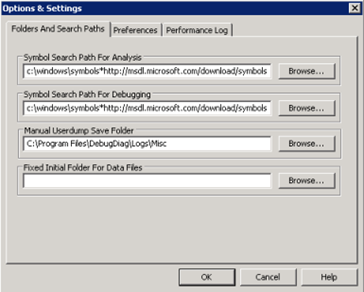
At this point, I am ready to produce the IE crash by going to the web page or performing the action that crashes it. The Debug Diagnostics window now records the event and a dump file is created. Click Analyze Data. 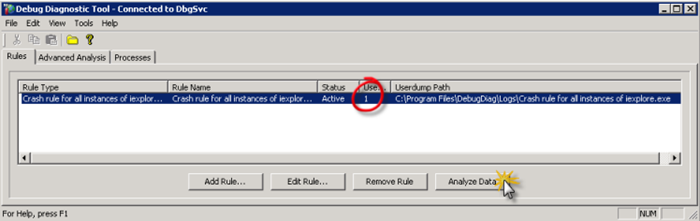
The results of analysis are displayed in IE. You will see a banner in IE, just right-click to allow the script to run. By the way, it is not uncommon to see an error in the beginning of crash analysis report. This happens when one of the modules in the dump is 3rd party for which there are no symbols available or, in the case here with wspwsp.dll, the module is not part of the normal Windows out-of-the-box experience or because it is a security component. 
The rest of the report follows: 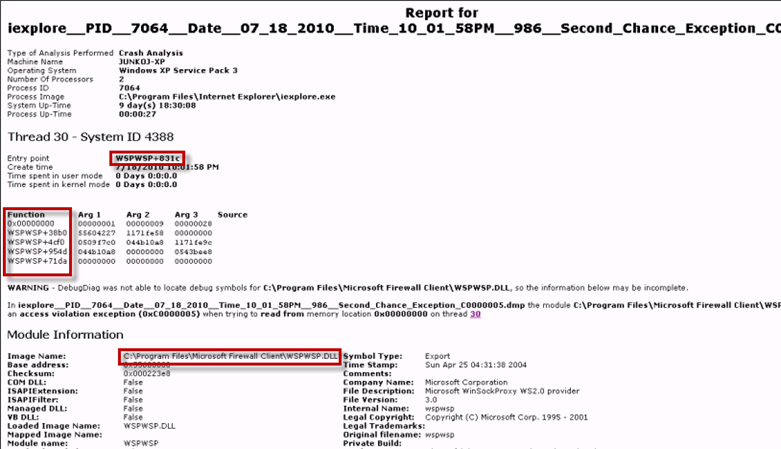
Unfortunately, the Debug Diagnostics tool could not identify this as a known issue and the only recommendation is to follow up with Microsoft (I actually used The Case of the Random Internet Explorer Crashes to generate this dump). In some cases, though, the tool can identify the issue and point you in the direction if the fix. 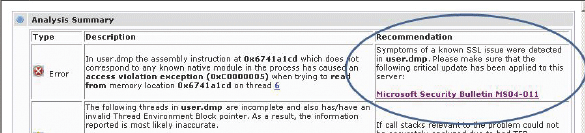
Again, he advantage to using this tool is that it runs in the background as a service, with no impact to system performance. Simply create a rule, start, and close or minimize. When done, delete the rule you created earlier. Also, Debug Diagnostics is a service, which can be disabled when it not needed instead of uninstalling. The services runs as the DbgSvc.exe process.
I should also mention that you can also use Debug Diagnostics to dump a hung process as well.

Another Case of IE and Outlook Crashes « Windows Explored said
[…] ways to work around this, the simplest and most GUI friendly is to use DebugDiag from Microsoft. I wrote about this sometime ago and it has since moved to version 2.1 but the approach I still the same for the most […]