Windows Explored

Everyday Windows Desktop Support, Advanced Troubleshooting & Other OS Tidbits

Archive for the ‘Troubleshooting’ Category

The Case of the Dysfunctional Adobe PDF Plugin

Posted by William Diaz on November 1, 2018


A while back we had decided to transition to a new PDF software application. Although we did pilot it, once it went into our production environment, the wider user audience found that there were too many issues with the new product and we decided to go back to Adobe Acrobat. Soon after, we began to receive complaints that working with PDFs from the Internet in IE was at times dysfunctional. Specifically, opening or trying edit form-fillable PDFs would result in a generic “Error opening URL to submit this form.”

Additionally, it was noticed the Acrobat PDF Toolbar in IE stopped working and clicking on it did nothing.

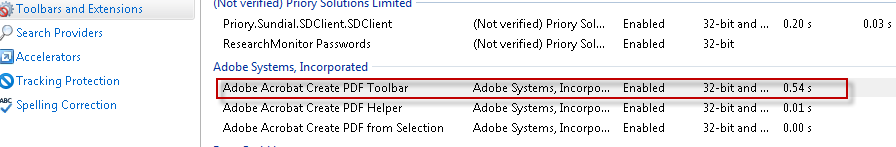
The first thing to check was that the toolbar add-on module was actually loaded into the browser. This can be done from Internet Options > Programs > Manage add-ons. And, yes, it seems to be there and enabled:

How about the actual DLL itself? Where this resides can be gathered from the bottom portion of the Manage add-ons window by clicking on More information:

Sure, enough, the DLL was present in C:\Program Files (x86)\Common Files\Adobe\Acrobat\WCIEActiveX\x64.

For a deeper dig, I fire up Process Explorer and set a filter to only look at iexplorer.exe processes. I clicked on the dysfunctional toolbar a couple times and stopped the trace. I further filtered the results using Count Occurrences from the Tools menu and focused on No Such File results as there were only a handful and if a dependency was missing, it should be easily spotted here. I quickly spotted the issue and knew what the problem was:

The Acrobat add-on for IE supports both 32bit and 64bit process modes for IE. However, the More information link above can only show you the path for the 64bit module if both are present. When I looked in the 32bit module path C:\Program Files (x86)\Common Files\Adobe\Acrobat\WCIEActiveX I could see that AcroIEFavClient.dll (the Adobe PDF Toolbar for IE) was missing from this path.

To verify this was the issue, I grabbed the 32bit DLL from a working computer and performed a file copy procedure using PSExec to the computer with the issue as this type of file copy has to be done as the system account because of the access permissions set on the folder (psexec -i -s cmd.exe). I fired up IE and was able to successfully run the toolbar. Additionally, the errors being seen when working with online PDFs also cleared up.

My guess was that somewhere between removing Acrobat PDF, installing its replacement, removing the replacement, and finally redeploying Acrobat created some contention during one of the file install operations and that dll went MIA. The quick fix for the user was simply to run a repair of Acrobat PDF via Programs & Features. Additionally, we setup a repair deployment to run using SCCM if AcroIEFavClient.dll was not present in C:\Program Files (x86)\Common Files\Adobe\Acrobat\WCIEActiveX.

Advertisement

Posted in Troubleshooting, Troubleshooting Tools | Tagged: , | 1 Comment »

Spinning Dots After Windows 10 Updates

Posted by William Diaz on October 23, 2018


Recently, we began to push a new batch of Windows 10 updates to several offices. The morning after, we started to receive complaints that several computers were hung up at what is often described as a “black screen with spinning white dots”.

Obviously, something had gone wrong after the updates were installed to the first batch of deployment offices. In some cases, psychically powering down the workstation seemed to correct from a brief time, but after another reboot the problem would come back*.  Oddly enough, we were able to RDP to all the affected workstations. RDP does not use the video display system of the computer you are connecting to render the display experience, but that of the computer that is doing the connection instead. This allowed us to uninstall the latest update(s) in an attempt to resolve. Unfortunately, this made no difference. Whatever had changed, had permanently affected the computers video display subsystem.

We ended up pulling the update deployment and I had one of the problem computers sent to me so I could look at more closely. My theory was that the Windows logon process was getting injected by something or otherwise was hooked by a process and it was preventing the user logon interface from displaying on the monitor. If that was the case, it should be pretty easy to spot.

I connected via RDP and fire up Process Explorer, and went to the winlogon.exe process to take a look. Sure enough, the issue presented itself:

During the boot phase and before the logon experience is ready, Windows will display the spinning dots as an indication that things are starting up. After that, winlogon.exe launches and begins the process of presenting the UI for logon. You can see here that LogonUI.exe (the actual logon interface) kicks off. The fact that there were dozens of LogonUI.exe processes running was an indication that this process was failing and winlogon was retrying after each failed instance. Looking inside one of the LogonUI processes showed that there was only a single thread and it was never fully initializing.

To see what was injecting into a process can be done a few different ways. The quickest is to use Process Explorer, go to View > check Show Lower Pane then View again, Lower Pane View > DLLs. In this case, I could see 3rd party hooking by various Citrix processes:

Alternatively, you can dump out the process by right-clicking on from Process Explorer or Task Manager and open it in WinDbg. Running a hang analysis on it (!analyze -v -hang) would venture a best guess from the debugger:

If you follow the stack trace up from the Citrix Hook you can see it end at initialization for gdi32full.dll, which is the Windows API that is leveraged by applications to do any number of graphical display work. In this case, this instance of Citrix hooking is the result of the Citrix VDA client being installed. The VDA client allows users to remotely access their office computers over the Internet via a Citrix login portal. However, in order to display the logon UI to remote user, it needs to hook the windows logon process.

As a proof of concept, I disabled hooking of the winlogon.exe process by the Citrix PortICA Winlogon dll, specifically PicaWinlogonHook64.dll. This can be done via the registry by going to HKLM\SOFTWARE\Citrix\CtxHook\AppInit_Dlls\PicaWinlogonHook and setting the DWORD Flag to 0 and restarting the computer (great article here). Upon doing so, the spinning dots issue corrected itself. Note, this itself is not the solution; setting this causes the Windows logon screen to not appear for anyone trying to remotely connect using the company Citrix login – VDA (they will get a grey screen).

After some more research, I found I couple Citrix KBs eluding to this issue and that this was specific to VDA client versions 7.14 (Citrix Virtual Delivery Agent 7.14.1) & 7.15 CU1 (Citrix 7.15 LTSR), which was about half our VDA clients in our environment. Thankfully, it did not affect VDA version 7.15 CU2, which was the other half.

Over the next few weeks we started the process of updating the VDA clients, which in itself became somewhat of a challenge. Ultimately, we ended up doing this part of the update as a task sequence, which ran the VDA cleanup utility in unattended mode (the native uninstall command was failing for some unknown reason in most cases), restarted the machine and then installed 7.15 CU2.

A guide for using the VDA cleanup tool can be found in this Citrix KB: How to Run the VDA Cleanup Utility with SCCM Task Sequences


*Of note, it was found that this issue could also be overcome by running windows Disk Cleanup as an admin and selecting the option Windows Update Cleanup. This has the effect of removing the various updated Windows files (otherwise, they are archived). The downside to this is that you would not be able to remove any problematic update going forward to restore the system to a previous stable point. It also did not guarantee that the issue would not resurface with the next batch of updates … not to mention it was taking 1 hour plus to complete in some cases and was not 100%. I’m still curious why it was working in many cases, though.

Posted in Inside Windows, Troubleshooting, Troubleshooting Tools | Leave a Comment »

IE & The Case of the 65,535 temp files

Posted by William Diaz on October 23, 2018


This is a bit old but I came across the screenshots I captured on one of my soon-to-be-retired workstations and I was reminded that I forgot to document this one.

The problem came about as a run-of-the-mill IE performance “very slow” escalations. Killing IE and restarting it did not resolve and it would consistently happen each time. After connecting to the workstation, I fired up Process Monitor and captured about 30 seconds worth of activity and then stopped the capture. I applied a filter for iexplore.exe and began to scroll down the almost 1 million operations generated in that short capture: A sore thumb stood out. Almost all the operations being performed by IE were file operations specific to temp files in the C:\Users\username\AppData\LocalLow\DLPTemp directory. Looking in that directory, I could see thousands of htp*.tmp files. In this directory was an additional sub-folders named Logs that contained a single log file, HDLP_IE.log. Opening it up revealed what seemed to be the problem: [10744] [OERROR] [Explorer Probe] [McAfee::DLP::HTTP::internals::processor_base_t::make_temp_file] Cannot generate a temporary file path; error=80 Unless you have deep-dived into Windows file system, its not common knowledge that Windows places a limitation on the number of temp files (.tmp) that can be generated into a single folder directory. That limitation is 65,535, and that limitation had already been reached. The issue was specific to only a handful of users, mostly those working in large document databases via the browser. The McAfee DLP plugin for IE “mirrors” these files as .tmp files for content analysis. Normally, these files should be cleaned up by DLP agent and for whatever reason they this was not working. Some quick research pointed to the cause and McAfee lays out the issue here https://kc.mcafee.com/corporate/index?page=content&id=KB84595&actp=null&viewlocale=en_US. The quick fix was to manually delete all the temp files in the directory until workstations could be updated to latest DLP Endpoint.

Posted in Inside Windows, Troubleshooting | Leave a Comment »

The Case of the Broken Windows Photo Viewer

Posted by William Diaz on September 9, 2016


A co-worker of mine was troubleshooting an issue where a user was unable to open images in the Windows Photo Viewer. Whenever she would try to view an image, the Photo Viewer would open but the image would never load; instead the image was replaced by the spinning blue circle. There was no issue opening the image with other image viewers. To troubleshoot, I fired up Process Monitor and captured a trace of the activity for a few seconds while trying to open the image.

Before starting, its worth noting that the Windows Photo Viewer is not an exclusive process that runs out of C:\Program Files (x86)\Windows Photo Viewer. It is actually executed by dllhost.exe, a host processes that is used by other processes (in this case explorer.exe) to launch code. If something were to go awry with hosted code, then it would only affect that instance of the host process and not explorer, which might crash the desktop.

After a few seconds of capture, I stopped collecting activity, went to Tools > Count Occurrences > Column: Result. My guess was that the Windows Photo Viewer was looking for something that it needed to properly load the images but could not find it. I selected the PATH NOT FOUND value and applied it. There I could see that dllhost.exe was unable to locate some files in C:\Windows\System32\spool\drivers\color.

image

I looked at a couple other systems and saw that this folder existed and was populated with the missing files the COM surrogate was looking for. I wasn’t sure how, why, who deleted this folder but I copied it to the problem computer, opened an image with Windows Photo Viewer and it was working.

Posted in Inside Windows, Troubleshooting | Tagged: | Leave a Comment »

ODT Setup Packager Error

Posted by William Diaz on February 16, 2016


Recently I needed to update my Office 2013 App-V 5 package. This is done via the Microsoft ODT tool by first downloading the content and then packaging using the /packager command. The download went fine, but upon running the packager phase the command would immediately go straight back to the prompt, which is an indication that something went wrong because the packager phase usually takes a good 10 minutes to run. I checked and double-checked the xml files used to build the package but it looked good. Troubleshooting the ODT setup is pretty straight forward, however; simply locate the setup logs in %temp%. They are named by computer name name + date.log. In my case, I kept encounter the following line in the logs:

02/12/2016 15:00:31.828    SETUP (0x1cc8)    0xc40        Click-To-Run Telemetry    ami7s    Monitorable    TryLaunchClient::HandleStateAction: C2R Client Install Process returned code 17003   
02/12/2016 15:00:31.828    SETUP (0x1cc8)    0xc40        Click-To-Run Telemetry    apx75    Monitorable    TryLaunchClient::HandleStateAction: C2R Client returned failing error code 17003   
02/12/2016 15:00:31.828    SETUP (0x1cc8)    0xc40        Click-To-Run Telemetry    aqdyq    Monitorable    TryHandleClientError::HandleStateAction: Another Scenario Running. Showing Error UI.   
02/12/2016 15:00:31.828    SETUP (0x1cc8)    0xc40        Click-To-Run Telemetry    aoh9g    Medium    TryShowUI::HandleStateAction: Failure has occured, admin has disabled failure UI.   
02/12/2016 15:00:31.828    SETUP (0x1cc8)    0xc40        Click-To-Run Telemetry    ami7r    Medium    TryShowUI::HandleStateAction: Showed Failure UI. Couldn’t start Office installation  We’re sorry, but we could not start your Office installation. Another installation is in progress. Please try again later.     
02/12/2016 15:00:31.828    SETUP (0x1cc8)    0xc40        Click-To-Run    aoh72    Medium    ExitBootStateMachine::HandleStateAction: Bootstrapper workflow exiting with result: 0x0   
02/12/2016 15:00:31.828    SETUP (0x1cc8)    0xc40        Click-To-Run Telemetry    aoh9z    Medium    AdminBootstrapper::Main: Installation came back with 17003.   
02/12/2016 15:00:31.829    SETUP (0x1cc8)    0xc40        Logging Liblet    aqc99    Medium    Logging liblet uninitializing.   

This wasn’t completely unexpected as I have used this computer previously to create my Office 2013 App-V packages. But I had never encountered it so I was not sure where to look to clean up the previous install. Enter Process Monitor. I fired it up, reproduced the issue, stopped the trace. Although the trace was only a few seconds, this will likely result in thousands or ten of thousands of operations being captured. This “noise” can quickly be cleaned up, though, using filters. I figured the likely culprit would be in the registry, so I started with limiting results to RegQueryKey. From there, I filtered for the only processes involved. With ODT, this is setup.exe which then calls OfficeClickToRun.exe.

image

From here, I could see HKEY_CURRENT_USER\Software\Microsoft\Office\15.0 was being touched. Note, that whatever version of Office you are packaging should not be installed on the machine where you are doing the packaging so any key created here would have been done by the ODT setup.

image

Simply delete this key and run setup /packager again.

Posted in Office, Troubleshooting | Tagged: | Leave a Comment »

A Quick One-Dimensional Stack Debug and Solution

Posted by William Diaz on December 17, 2015


I am a big fan of debugging tools, especially WinDbg. These tools can be quite complicated but most of the time I use them simply for a “one-dimensional” analysis of an application or system crash and use the information from the dump to find a cause and hopefully the most logical fix. In the example here, a user complains that PowerPoint-Excel is often crashing or becoming hung. I was able to locate a couple of errors in the Event Viewer > Application Logs that indicated a crash had taken place within the MS Office product, but it was too generic and failed to resolve to the failing component. I asked the user to manually create a crash dump for me the next time the issue happened by using the Task Manager > Applications > right-clicking the unresponsive PowerPoint or Excel application > Select Create Dump File. The dump file gets sent to the user’s temp directory, e.g. C:\Users\username\AppData\Local\Temp\AppName.DMP.

I copied the dmp and opened with with WinDbg. Note, if you are analyzing a 32bit application dump (often the case with MS Office – because who actually uses 64bit office?) you will want to use the 32bit version of WinDbg. Or, if you are incredibly lazy like me (can’t figure out what happened to my x86 version), you can use the 64bit WinDbg and change it use x86-based processor mode. Just run .load wow64exts followed by .effmach x86, followed by the always faithful !analyze –v –hang.

This resulted in following output (Including only the stack text since everything before this is not useful) :

STACK_TEXT: 
00392774 75751605 00000001 003927c4 00000001 ntdll_776f0000!ZwWaitForMultipleObjects+0x15
00392810 769619f8 003927c4 00392838 00000000 KERNELBASE!WaitForMultipleObjectsEx+0x100
00392858 5e558ac9 00000001 7efde000 00000000 kernel32!WaitForMultipleObjectsExImplementation+0xe0
WARNING: Stack unwind information not available. Following frames may be wrong.
00392898 5e58f314 00000001 02b68204 ffffffff MSO!Ordinal10580+0x28e
003928d0 5e589c1c 00000000 003928ec 02b69140 MSO!Ordinal4721+0x114
00392900 5e58a80a 02421880 ffffffff 02b68200 MSO!Ordinal5739+0x18a
00392914 2d5b9771 02421880 2d4d05b6 00392948 MSO!Ordinal9231+0x2d6
00392924 2d4d1ebe 00000001 2dc983fc 00000000 PPCORE!DllGetLCID+0xc2eb7
00392948 2d5666de 00000001 84008571 0af19000 PPCORE!PPMain+0x4b010
0039427c 2d5660c3 02b69140 00000425 84009249 PPCORE!DllGetLCID+0x6fe24
00395544 2d563d9f 8400a15d 003966d4 02c40000 PPCORE!DllGetLCID+0x6f809
00396650 2d4a2c41 02c40000 2d4a2be8 02c40000 PPCORE!DllGetLCID+0x6d4e5
00396668 2d5c949b 003966d4 00000000 00000000 PPCORE!PPMain+0x1bd93
00399a64 2d5c90e3 00399a80 84005dbd 0af1928c PPCORE!DllGetLCID+0xd2be1
00399ab0 2d7beff6 0af19000 00399b7c 00399b08 PPCORE!DllGetLCID+0xd2829
0039be34 5f1ea45e 0039bf00 5f1ec17c 76a3030c PPCORE!DllGetLCID+0x2c873c
0039be48 769a03ab 0039bf00 8405ee7f 00000000 MSO!MsoCrashMainThread+0x21f
0039bed0 77763b8f 0039bf00 77763a6c 00000000 kernel32!UnhandledExceptionFilter+0x127
0039bed8 77763a6c 00000000 0039f934 7771c500 ntdll_776f0000!__RtlUserThreadStart+0x62
0039beec 77763911 00000000 00000000 00000000 ntdll_776f0000!_EH4_CallFilterFunc+0x12
0039bf14 777533dd fffffffe 0039f924 0039c050 ntdll_776f0000!_except_handler4+0x8e
0039bf38 777533af 0039c000 0039f924 0039c050 ntdll_776f0000!ExecuteHandler2+0x26
0039bf5c 77753350 0039c000 0039f924 0039c050 ntdll_776f0000!ExecuteHandler+0x24
0039bfe8 77700133 0139c000 0039c050 0039c000 ntdll_776f0000!RtlDispatchException+0x127
0039bff4 0039c000 0039c050 c0000005 00000000 ntdll_776f0000!KiUserExceptionDispatcher+0xf
0039c4b4 588a6fa9 00000001 00000800 0a346c84 0x39c000
0039c4cc 588a6f52 0a346cac 0039c4e8 5e567954 GFX!Ordinal818+0x1cf
0039c4f4 588a6ea1 00000020 00000800 00000008 GFX!Ordinal818+0x178
0039c5a0 588a6e0a 004066c0 0039c990 00000001 GFX!Ordinal818+0xc7
0039c5cc 51333fb1 0039c644 0039c990 00000001 GFX!Ordinal818+0x30
0039c638 51333f12 00000001 004066c0 0039c990 OART!Ordinal910+0x4f8
0039c668 63818573 0039c8ac 00000000 00000001 OART!Ordinal910+0x459
0039c8d8 6381848e 0039c910 00000000 00000001 RICHED20!RichListBoxWndProc+0xb6d2
0039c918 6aebac5f 05755318 0578b628 00000000 RICHED20!RichListBoxWndProc+0xb5ed
0039c984 6aebadf3 05757e58 00000020 00000000 MSPTLS!LssbFIsSublineEmpty+0xb13c
0039c9a8 6aeb1aea 0000000d 00000004 0039cae8 MSPTLS!LssbFIsSublineEmpty+0xb2d0
0039ca58 6aeb2295 05755f08 0039cd58 0001165b MSPTLS!LssbFIsSublineEmpty+0x1fc7
0039cae0 6aebf7fb 00000000 0039cd58 00000000 MSPTLS!LssbFIsSublineEmpty+0x2772
0039cb44 6aebff10 05755cc8 00000000 0039cd74 MSPTLS!LssbFIsSublineEmpty+0xfcd8
0039cb74 6aebf0cc 00000000 00000000 0c6651f0 MSPTLS!LssbFIsSublineEmpty+0x103ed
0039cd80 6aea4c98 057556e8 00000111 00010dec MSPTLS!LssbFIsSublineEmpty+0xf5a9
0039cdb4 6380f006 057556e8 00000111 00010dec MSPTLS!LsCreateLine+0x23
0039ced4 638005df 00000003 00000000 ffffffff RICHED20!RichListBoxWndProc+0x2165
0039cf2c 638002da 0039d894 00000003 00000000 RICHED20!IID_ITextServices2+0x65f3
0039cf68 63816f3b 0039d894 00000003 00000000 RICHED20!IID_ITextServices2+0x62ee
0039cf94 63816aa1 0c694c00 00000111 ffffffff RICHED20!RichListBoxWndProc+0xa09a
0039cfe4 63816987 00000001 ffffffff 00000111 RICHED20!RichListBoxWndProc+0x9c00
0039d060 6af33a5d 057552c0 00000009 00000009 RICHED20!RichListBoxWndProc+0x9ae6
0039d0f0 6af3ec94 0577ffe8 00000009 00000009 MSPTLS!LsLwMultDivR+0x13786
0039d1a8 6af3854d 0577ffe8 00000000 00000000 MSPTLS!LsLwMultDivR+0x1e9bd
0039d264 6af39b13 0c6534f8 00000000 00000000 MSPTLS!LsLwMultDivR+0x18276
0039d388 6af185ed 0039d448 0c6534f8 0039d49c MSPTLS!LsLwMultDivR+0x1983c
0039d404 6af18f8a 0039d448 0c6534f8 0000ad40 MSPTLS!FsTransformBbox+0xf44e
0039d4ec 6af316a1 0577ffe8 00000000 0000ad40 MSPTLS!FsTransformBbox+0xfdeb
0039d55c 6af31913 0c6534f8 00000009 00000004 MSPTLS!LsLwMultDivR+0x113ca
0039d5f0 6af176b9 00000001 0c6534f8 0c652544 MSPTLS!LsLwMultDivR+0x1163c
0039d644 6af0d8a1 0c652528 00000000 00000000 MSPTLS!FsTransformBbox+0xe51a
0039d6d0 6af0decb 00000000 0c6534f8 00000000 MSPTLS!FsTransformBbox+0x4702
0039d79c 6af02099 0577fa10 00000000 0039d874 MSPTLS!FsTransformBbox+0x4d2c
0039d7b4 63814a25 0577fa10 00000000 0039d874 MSPTLS!FsCreatePageBottomless+0x2d
0039d850 6381478b 0039d874 00010dec 0c6af128 RICHED20!RichListBoxWndProc+0x7b84
0039d87c 638145ef 057552c0 00010dec 0c6af128 RICHED20!RichListBoxWndProc+0x78ea
0039d9bc 63813bac 3fffffff 00400000 0c679bb8 RICHED20!RichListBoxWndProc+0x774e
0039dca0 6380e3b1 0039dcf0 00000185 00000185 RICHED20!RichListBoxWndProc+0x6d0b
0039dcd0 637fa38d 0039dcf0 00000185 00000185 RICHED20!RichListBoxWndProc+0x1510
0039dd4c 63812db5 0578eaec 0039dd8c 63812b45 RICHED20!IID_ITextServices2+0x3a1
0039dd58 63812b45 0c67dd40 0039dda0 00000000 RICHED20!RichListBoxWndProc+0x5f14
0039dd8c 51332427 0039ddcc 0e0d0dd0 0e0d0dd8 RICHED20!RichListBoxWndProc+0x5ca4
0039de50 51332095 0050b0d0 0dc6de00 0dc6def8 OART!Ordinal7653+0x502
0039de68 51331e34 0e0d0c40 0039de88 84001d0e OART!Ordinal7653+0x170
0039df84 5132f344 0e0d0c40 0dc6de60 0e0dc0c4 OART!Ordinal525+0xb7b
0039dfc4 51337c8c 0039e058 0039dffc 51337c59 OART!Ordinal6914+0x2c0
0039dfd0 51337c59 0dc6de00 84001d76 0dc6de00 OART!Ordinal3680+0xe8f
0039dffc 5133b804 0dc6de00 840022a2 0dc6de00 OART!Ordinal3680+0xe5c
0039e028 5133b7a6 0dc6de00 840022e6 0dc6de00 OART!Ordinal5150+0x240
0039e06c 513aeed3 0000000e 0039e088 00000000 OART!Ordinal5150+0x1e2
0039e090 513af827 0039e138 840023c2 027fe980 OART!Ordinal389+0x119
0039e148 518017a0 007fe964 0000b298 0039e198 OART!Ordinal1309+0x69d
0039e174 2d803b5a 02808460 0039e198 0039e1a0 OART!Ordinal5501+0x2d
0039e1c8 2d606bb6 02808464 0039e47c 840023a5 PPCORE!DllGetLCID+0x30d2a0
0039e4a8 2d4d2181 02220b44 02808464 0039e4c8 PPCORE!DllGetLCID+0x1102fc
0039e4b8 2d4d1cb4 02220a00 029a5600 0039e4fc PPCORE!PPMain+0x4b2d3
0039e4c8 2d4cf07c 00000004 029a5600 00000000 PPCORE!PPMain+0x4ae06
0039e4fc 2d4cf049 00000004 029a5600 0039e51c PPCORE!PPMain+0x481ce
0039e50c 2d4cf02a 00000004 0285c860 0039e52c PPCORE!PPMain+0x4819b
0039e51c 2d4ced04 00000004 0039e594 0039e564 PPCORE!PPMain+0x4817c
0039e52c 2d49492f 00000004 84002269 2df23040 PPCORE!PPMain+0x47e56
0039e564 2d49385d 2df23040 005849e0 00000000 PPCORE!PPMain+0xda81
0039e578 2d4937ea 0039e594 840022cd 2df23040 PPCORE!PPMain+0xc9af
0039e5c0 2d486f1e 84003f59 2df23040 005849e0 PPCORE!PPMain+0xc93c
0039f854 2df215ae 2df21575 2df20000 00000000 PPCORE!PPMain+0x70
0039f8e8 7696338a 7efde000 0039f934 777297f2 POWERPNT+0x15ae
0039f8f4 777297f2 7efde000 767616c8 00000000 kernel32!BaseThreadInitThunk+0xe
0039f934 777297c5 2df210c8 7efde000 ffffffff ntdll_776f0000!__RtlUserThreadStart+0x70
0039f94c 00000000 2df210c8 7efde000 00000000 ntdll_776f0000!_RtlUserThreadStart+0x1b

Stacks are read from the bottom up so you can get a very basic idea of what is happening as you climb the ladder. We are really only interested in the component details … and maybe the method-routine of that component (assuming you have the symbols). For example, we start with the main PowerPoint component, PPCORE (everything after the ! is the method or routine). That calls into OART, which is the Office Art components of the MS Office suite, which goes into RICHED20, which I am guessing is something like rich text box component, then to another office component, MSPTLS, and again into another MS Office art component, GFX. After GFX you can see a couple exceptions (errors) are encountered before passing back into the main PowerPoint dll.

Hint: if you are not sure what these components are or belong to, open a new command browser in WinDbg and use the lmvm command to get the details of it, e.g. lmvm GFX:

start             end                 module name
588a0000 58a4d000   GFX        (export symbols)       GFX.DLL
    Loaded symbol image file: GFX.DLL
    Image path: C:\Program Files (x86)\Microsoft Office\Office14\GFX.DLL
    Image name: GFX.DLL
    Timestamp:        Fri Jun 28 18:43:07 2013 (51CE117B)
    CheckSum:         001B6FED
    ImageSize:        001AD000
    File version:     14.0.7104.5000
    Product version:  14.0.7104.0
    File flags:       0 (Mask 3F)
    File OS:          40004 NT Win32
    File type:        1.0 App
    File date:        00000000.00000000
    Translations:     0000.04e4
    CompanyName:      Microsoft Corporation
    ProductName:      Microsoft Office 2010
    InternalName:     GFX
    OriginalFilename: GFX.DLL
    ProductVersion:   14.0.7104.5000
    FileVersion:      14.0.7104.5000
    FileDescription:  Microsoft OfficeArt
    LegalCopyright:   © 2010 Microsoft Corporation.  All rights reserved.


So, from the stack above, my first guess is that we have an issue with some graphic module(s) – and maybe to a greater part the video subsystem (not necessarily the fault of MS Office). To confirm, I can look at all the thread stacks by dumping them with ~*kb. Reading from the bottom up, it looks like the problem starts with thread 15 (similar to what !analyze –v –hang shows):

15  Id: 944.1ffc Suspend: 0 Teb: 7efd8000 Unfrozen
ChildEBP RetAddr  Args to Child             
0e9ec8c8 7772c81a 00000bd4 00000000 00000000 ntdll_776f0000!ZwWaitForSingleObject+0x15
0e9ec92c 7772c6fe 00000000 00000000 0000000e ntdll_776f0000!RtlpWaitOnCriticalSection+0x13e
0e9ec954 637f3de0 63913530 05750f1c 637f837e ntdll_776f0000!RtlEnterCriticalSection+0x150
WARNING: Stack unwind information not available. Following frames may be wrong.
0e9ec974 63809412 0000000e ffffffff 057542c8 RICHED20+0x3de0
0e9ec98c 637fa8a3 ffffffff 00000000 0c66df94 RICHED20!IID_ITextServices2+0xf426
0e9eca10 6380a7d3 ffffffff 00000016 0c66df94 RICHED20!IID_ITextServices2+0x8b7
0e9eca38 637f9c7d 00000000 00000016 00000016 RICHED20!IID_ITextServices2+0x107e7
0e9eca5c 637f951a 0e9ecd64 00000000 00000016 RICHED20!IID_ITextHost+0xaf1
0e9ecb20 637ff8c9 00000016 00000016 0e9ece80 RICHED20!IID_ITextHost+0x38e
0e9ecbc4 63806564 00000016 0e9ece80 00000000 RICHED20!IID_ITextServices2+0x58dd
0e9ed000 63805843 0e9ed21c 0e9ed290 0c6660e4 RICHED20!IID_ITextServices2+0xc578
0e9ed1fc 638057bf 00000527 0e9ed22c 0e9ed21c RICHED20!IID_ITextServices2+0xb857
0e9ed240 51330ed8 0e9ed290 009ed274 51330ee8 RICHED20!IID_ITextServices2+0xb7d3
0e9ed254 51330821 0e9ed290 0e9ed274 8aa7103a OART!Ordinal582+0x86a
0e9ed2b0 5133e25c 02ec3c40 00000000 00000017 OART!Ordinal582+0x1b3
0e9ed2f4 5133e0a9 02ec3c40 8aa711ea 00000001 OART!Ordinal3092+0x234
0e9ed360 5133de56 0e9ed43c 8aa71112 00000001 OART!Ordinal3092+0x81
0e9ed398 5156385e 0e9ed43c 8aa71c22 02caed40 OART!Ordinal5804+0x49
0e9edea8 51c8ac06 027fdda8 000da976 001ecfe4 OART!Ordinal3710+0x1f0b
0e9ee010 51c8e83f 0e9ee1ac 0e9ee194 02d47a00 OART!Ordinal3134+0xdad1
0e9ee1e0 51c8af32 0000005e 02d47a00 0e9ee2e4 OART!Ordinal3134+0x1170a
0e9ee1f0 51c84008 0000005e 8aa7206e 0dc531d8 OART!Ordinal3134+0xddfd
0e9ee2e4 51c8477e 029b7e00 0dc53000 00000000 OART!Ordinal3134+0x6ed3
0e9ee338 51c76c9c 00000000 0dc6d000 029b7e00 OART!Ordinal3134+0x7649
0e9ee358 51c53869 00000000 0dc6d000 029b7e00 OART!Ordinal7663+0x111f5
0e9ee388 51c53d8f 029b7e00 0af6a780 00000000 OART!Ordinal5848+0x31bbe
0e9ee46c 51c541f7 01f6a780 00000007 00000000 OART!Ordinal5848+0x320e4
0e9ee494 51c513be 0af6a780 ffffffff 00000001 OART!Ordinal5848+0x3254c
0e9ee510 5166ed08 00000001 023d5100 00000000 OART!Ordinal5848+0x2f713
0e9ee650 5157b3e7 fffffffe 00000000 0dc70500 OART!Ordinal4701+0x7d347
0e9ee6b8 5157af1c 027fdda8 027fdd80 0e9ee798 OART!Ordinal1690+0x6a98
0e9ee750 51565415 0e9ee790 0e9eed80 027fde94 OART!Ordinal1690+0x65cd
0e9ee764 5156534d 00000000 0e9eed80 027fde94 OART!Ordinal2289+0xadd
0e9eebd4 515651db 0e9eed80 00000000 0e9eecf8 OART!Ordinal2289+0xa15
0e9eed2c 51564f8e 003d9fc8 00000000 00000000 OART!Ordinal2289+0x8a3
0e9eeedc 51564b24 0e9eeefc 00000000 8aa72d96 OART!Ordinal2289+0x656
0e9eef1c 51307adf 0e9eefa0 0e9ef050 0e9eefc4 OART!Ordinal2289+0x1ec
0e9eef2c 513077ae 0e9eefa0 8aa72d4e 00000000 OART!Ordinal4963+0x46
0e9eefc4 5132afe4 0e9ef050 0e9ef068 8aa732ea OART!Ordinal2541+0xfd
0e9ef060 5132afe4 02b61720 0e9ef104 8aa73276 OART!Ordinal4433+0x3e9
0e9ef0fc 5132afe4 02b615d0 0e9ef1a0 8aa73312 OART!Ordinal4433+0x3e9
0e9ef198 513075f0 02b613f0 0e9ef1d8 8aa7335a OART!Ordinal4433+0x3e9
0e9ef1d0 51303605 02b6aab0 02de3c84 8aa7308e OART!Ordinal2385+0x142
0e9ef204 513035b2 02a95dc0 00000000 51303401 OART!Ordinal2513+0xde
0e9ef240 2d4d96eb 8aa7342d 0e9ef560 0e9ef4cc OART!Ordinal2513+0x8b
0e9ef320 2d4d941b 03382e44 0e9ef240 af01221d PPCORE!PPMain+0x5283d
0e9ef404 2d4d91af 0e9ef338 0e9ef530 af01221d PPCORE!PPMain+0x5256d
0e9ef554 2d4d8fbc 027fd180 027fd180 00000002 PPCORE!PPMain+0x52301
0e9ef5a4 2d4d8d6f 027fd180 0e9ef578 00000002 PPCORE!PPMain+0x5210e
0e9ef604 2d4d8c64 0e9ef5c8 0e9ef630 02423788 PPCORE!PPMain+0x51ec1
0e9ef644 2d4d8b76 8aa7317d 0ae0ef20 2dcaba78 PPCORE!PPMain+0x51db6
0e9ef670 2d4d8b43 8aa73191 0ae0aa94 0ae0aa84 PPCORE!PPMain+0x51cc8
0e9ef69c 2d48f094 0e9ef6c3 8aa731d9 0e9ef7b8 PPCORE!PPMain+0x51c95
0e9ef6d4 2d48f053 0e9ef720 5e574ea6 0ae0aa80 PPCORE!PPMain+0x81e6
0e9ef6dc 5e574ea6 0ae0aa80 02421880 8a953774 PPCORE!PPMain+0x81a5
0e9ef720 5e556cf0 02421880 0e9ef7b8 02859214 MSO!Ordinal3920+0x30
0e9ef740 5e556be1 0e9ef7b8 00000000 0e9ef79c MSO!Ordinal6535+0x5cb
0e9ef75c 5e553ba1 0e9ef7b8 00000000 003fa7f0 MSO!Ordinal6535+0x4bc
0e9ef790 5e551d40 003fa7f0 00000000 5e551d40 MSO!Ordinal3125+0x1f0
0e9ef7ec 7696338a 003fa7f0 0e9ef838 777297f2 MSO!MsoFRegGetDwCore+0x26f
0e9ef7f8 777297f2 003fa7f0 78d117c4 00000000 kernel32!BaseThreadInitThunk+0xe
0e9ef838 777297c5 5e551ce8 003fa7f0 ffffffff ntdll_776f0000!__RtlUserThreadStart+0x70
0e9ef850 00000000 5e551ce8 003fa7f0 00000000 ntdll_776f0000!_RtlUserThreadStart+0x1b


Immediately after, thread 14 reveals Direct 3D 9 runtime component, which is the core multimedia APIs from Microsoft:

14  Id: 944.218c Suspend: 0 Teb: 7ef12000 Unfrozen
ChildEBP RetAddr  Args to Child             
0fe7f8bc 757514b9 00000ba4 00000000 00000000 ntdll_776f0000!ZwWaitForSingleObject+0x15
0fe7f928 76961194 00000ba4 ffffffff 00000000 KERNELBASE!WaitForSingleObjectEx+0x98
0fe7f940 76961148 00000ba4 ffffffff 00000000 kernel32!WaitForSingleObjectExImplementation+0x75
0fe7f954 668f801f 00000ba4 ffffffff 00000000 kernel32!WaitForSingleObject+0x12
0fe7f970 668f8073 0fe7f984 7696338a 0eef0040 d3d9!CBatchFilterI::WorkerThread+0x24
0fe7f978 7696338a 0eef0040 0fe7f9c4 777297f2 d3d9!CBatchFilterI::LHBatchWorkerThread+0xd
0fe7f984 777297f2 0eef0040 79a81638 00000000 kernel32!BaseThreadInitThunk+0xe
0fe7f9c4 777297c5 668f8066 0eef0040 ffffffff ntdll_776f0000!__RtlUserThreadStart+0x70
0fe7f9dc 00000000 668f8066 0eef0040 00000000 ntdll_776f0000!_RtlUserThreadStart+0x1b


At this point, I decide to check for a later version of the graphics drivers for the users computer and found a newer driver release. Install, reboot, and no further Office applications reported since. Altogether, the process of identifying the basic issue itself took no more than 10 minutes, all without any software engineer credentials.

Posted in Troubleshooting, Troubleshooting Tools | Tagged: , , | 2 Comments »

The Case of the Failed MSI

Posted by William Diaz on December 3, 2015


I recently began encountering a problem where one of our application packages was getting hung during the install process. I could see the program directory correctly populated with application files but it seemed to get hung at end, and msiexec processes continued to run indefinitely. After manually killing each process, I checked to see if the application actually completed installing. When trying to run one of the applications that has a dependency on one of the failed MSI’s APIs, I encountered the following:

image

Further, Outlook was crashing when trying to load the application’s main component.

Faulting application name: OUTLOOK.EXE, version: 14.0.7012.1000, time stamp: 0x514a1b69
Faulting module name: imFileSite.dll, version: 8.5.3006.93, time stamp: 0x52d811c0
Exception code: 0xc0000005
Fault offset: 0x0008637e
Faulting process id: 0xd18
Faulting application start time: 0x01d12d4e055d29fc
Faulting application path: C:\Program Files (x86)\Microsoft Office\Office14\OUTLOOK.EXE
Faulting module path: C:\Program Files (x86)\Interwoven\WorkSite\iOutlook\imFileSite.dll


My guess was that the application’s components were not getting registered. To confirm, I manually registered all the components in the program directly via the command line:

FOR /R "C:\Program Files (x86)\ApplicationFolder" %G IN (*.dll) DO "%systemroot%\system32\regsvr32.exe" /s "%G").

Afterwards, the application with the dependency launched without error and Outlook was no longer crashing. However, the root issue still needed to be identified as I had no idea what else in the MSI was failing to complete. After manually deleting the components from the file system (it was missing from Programs and Features), I ran the MSI again and this time used Process Explorer to look inside the hung msiexec processes. There were multiple processes running, but I could see one process, though, eating CPU resources, and this was likely where I might find the culprit:

image

Opening the process details, I select the Threads tab. The thread that is doing all the work (or in this case getting hung up) is indicated by the Cycles tab. From here, I opened the thread by selecting it and clicking Stack:

image

Stacks are read from the bottom up. You can see a 3rd party component here (HCApi – McAfee HIPS) at play. Note, this might not be entirely abnormal as you can always expect any anti-virus suite to be hooking itself into any number of processes. So, to confirm what I was seeing, I used the Task Manager to dump the msiexec process that was using the CPU time by right-clicking it and select Create dump file (which can also be done via Process Explorer):

image

Dumps can be analyzed with WinDbg or a tool like DebugDiag 2.0. I have grown increasingly lazy and forgetful over the years with WinDbg. It has a very high learning curve and if you don’t use it much, its easy to forget everything except the old faithful !analyze –v or !analyze –v –hang. I used DebugDiag instead. When it is installed, simply right-click the dump file and select Analyze Crash/hang Issue from the context menu and point it to the crash file.

image

image

It will do its best to figure out the issue in the most vague way and you almost always need to do some interpretation of your own. For the most part, the analysis summary can be ignored.

image

A little bit down in the report points me to what I was seeing in Process Explorer with the problem thread that was using all the CPU time:

image

You can click the Thread ID like a hyperlink to follow it down in the report, expanding the thread. It reveals a familiar site. However, there is a bit more insight as the entry point is revealed and I can see the problem has something to do with the CustomAction table of the MSI itself.

image

Through a quick process of elimination using Orca to remove some of the rows in the CustomAction table, I narrow down the cause specifically down to action ISSelfRegisterCosting.

image

Without that row, the MSI install completes normally; or so at least it seems. I have no idea what removing this action might have elsewhere so this merely a hack. To further confirm the problem is being caused by McAfee, I perform the install on a virtual machine where McAfee is not installed and it proceeds normally. I then reach out to our McAfee enterprise admin and ask him to disable HIPS on one of my workstation. After doing so, the MSI runs and the application installs as expected. He inherits the problem.


Update

This has since been corrected by MacAfee with a HIPS update. One of the DLLs trying to get registered was getting blocked.

Posted in Troubleshooting, Troubleshooting Tools | Tagged: , | 9 Comments »

Another Case of IE and Outlook Crashes

Posted by William Diaz on February 26, 2015


I haven’t done one of these in quite awhile. So without further ado.

The symptom: Internet Explorer 11 and Outlook were crashing*. This was happening in all cases after applying a new task sequence. The event viewer did not produce any events that would help so I configured the system to capture crash dumps for applications. After rebooting, I reproduced the crash by simply opening IE an grabbed one of the dumps and ran it through an x86 debugger (by default, the 32bit Content tabs in IE 11 run as 32bit processes). Using ! analyze –v command produced the following output:

STACK_TEXT: 
WARNING: Frame IP not in any known module. Following frames may be wrong.
0339e974 6818a97d 005a09f8 0339e994 5226b9f5 0x490054
0339e9d8 68193c6f 0059f730 0059f7ec 5226bb49 D3D10Level9!UMAdapter::UnderlyingGetCaps+0x31
0339eb64 681940c2 0059f730 0339ebb4 00000002 D3D10Level9!UMAdapter::Open+0x165
0339eb98 69e0cae6 0339ebb4 523e5d23 00020009 D3D10Level9!OpenAdapter10_2+0x45
0339ebdc 69de09c2 005a09f8 0059f35c 69dda858 d3d11!NDXGI::CUMDAdapter::CUMDAdapter+0x18b
0339edc8 69de05fd 0339f0f0 00000002 00000029 d3d11!CCreateDeviceCache::CUMDAdapterCache::Load+0x1fc
0339ee18 69de12f3 0339f0b8 0339ee90 00009300 d3d11!CCreateDeviceCache::CAdapterCache::ResolveUMDAndVersion+0xc8
0339f1f4 69de1e4e 00000000 00595190 00000000 d3d11!D3D11CoreCreateDevice+0x353
0339f484 69de1bdd 00595190 00000000 00000000 d3d11!D3D11CreateDeviceAndSwapChain+0x268
0339f4bc 5bd5b4ed 00595190 00000000 00000000 d3d11!D3D11CreateDevice+0x2c
0339f4f8 5bd5c698 00000001 0339f58c 0339f564 mshtml!CDXGIHelper::CreateD3DDevice+0x48
0339f520 5bd5bc31 72657200 001af5f2 005910fc mshtml!CDXHelper::CreateD3D11Device+0x99
0339f6fc 5bd5ba45 00000000 00000000 00000000 mshtml!CDXResourceDomain::EnsureD3DDevice+0x82
0339f718 5bd5b9ad 00000000 00000000 00000000 mshtml!CDXResourceDomain::Initialize+0x67
0339f734 5bb35771 5c81e03c 00000000 00000000 mshtml!CDXResourceDomain::Create+0x48
0339f76c 5bd5a4c9 0339f78c 00000000 00538c78 mshtml!CDXResourceDomain::EnsureSharedDomain+0xa9
0339f7a0 671015ca 670b21cc 00000000 00000000 mshtml!CDXResourceDomain::EarlyStartDisplaySystem+0xe8
0339f7a4 670b21cc 00000000 00000000 00545cf8 ieframe!DirectUI::TouchEdit2::_UpdatePrompt+0x22
0339f7bc 77647df9 00538c78 744d2d1c 0053b958 ieframe!ExecuteWorkItemThreadProc+0x30
0339f830 77632b65 00538c78 00545cf8 744d2cbc ntdll!RtlpTpWorkCallback+0x11d
0339f990 76d6339a 0053b950 0339f9dc 7761bf32 ntdll!TppWorkerThread+0x572
0339f99c 7761bf32 0053b950 744d2cf0 00000000 kernel32!BaseThreadInitThunk+0xe
0339f9dc 7761bf05 776325c1 0053b950 ffffffff ntdll!__RtlUserThreadStart+0x70
0339f9f4 00000000 776325c1 0053b950 00000000 ntdll!_RtlUserThreadStart+0x1b

STACK_COMMAND:  ~2s; .ecxr ; kb

SYMBOL_STACK_INDEX:  0

SYMBOL_NAME:  unknown!printable+0

FOLLOWUP_NAME:  MachineOwner

MODULE_NAME: unknown

IMAGE_NAME:  unknown

DEBUG_FLR_IMAGE_TIMESTAMP:  0


I know D3D is Microsoft Direct X. To validate this, simply run the command lmvm d3d11:

0:002> lmvm d3d11
start    end        module name
69dd0000 69f45000   d3d11      (pdb symbols)          c:\symbols\d3d11.pdb\A40CED7361AB405886384123277BE23F1\d3d11.pdb
    Loaded symbol image file: d3d11.dll
    Image path: C:\Windows\System32\d3d11.dll
    Image name: d3d11.dll
    Timestamp:        Wed Mar 27 18:48:45 2013 (5153774D)
    CheckSum:         0017E157
    ImageSize:        00175000
    File version:     6.2.9200.16570
    Product version:  6.2.9200.16570
    File flags:       0 (Mask 3F)
    File OS:          40004 NT Win32
    File type:        2.0 Dll
    File date:        00000000.00000000
    Translations:     0409.04b0
    CompanyName:      Microsoft Corporation
    ProductName:      Microsoft® Windows® Operating System
    InternalName:     D3D11.dll
    OriginalFilename: D3D11.dll
    ProductVersion:   6.2.9200.16570
    FileVersion:      6.2.9200.16570 (win8_gdr.130327-1526)
    FileDescription:  Direct3D 11 Runtime
    LegalCopyright:   © Microsoft Corporation. All rights reserved.


A good guess is that the issue we are encountering is graphics driver related.

I wanted to see if that was the case with Outlook as well. However, that would require a different approach as Outlook was not producing any crash dumps to run through the debugger. Although there are several ways to work around this, the simplest and most GUI friendly is to use DebugDiag from Microsoft. I wrote about this sometime ago and it has since moved to version 2.1 but the approach I still the same for the most part. I simply ran DebugDiag Collection, created a crash rule, specified outlook.exe as the process. After starting Outlook, several dumps were generated. When complete I then launched DebugDiag Analysis, selected the last dump and then selected Start Analysis. The report generates as an htlm file and opens automatically in IE.

The analysis takes some of the guess work of how to proceed when you have little or no understanding of WinDbg. I could see my suspicion that the issue common to both IE and Outlook was the same, which does not surprise me as they both share common modules.

image

As a proof of concept, one way to test issues you suspect may be graphics related to IE if your system uses dedicated graphics is to disable GPU rendering in IE. This is done by going into the Control Panel > Internet Options > Advanced > and checking Use software rendering instead of GPU rendering (note, although the asterisk indicates you should restart your computer, only restarting IE may be required). In my case, this corrected the problem with IE so I was sure now that the issue was related to the graphics card. Before updating the driver, I checked the display information to see if perhaps the drivers were missed and maybe generic drivers were installed. This didn’t seem to be the case:

image

I would still update the drivers anyway. After doing so, both Internet Explorer and Outlook opened without crashing. Interestingly, after updating the drivers, the workstation reported a different video adapter model:

image

In the end, the resolution was to install the correct graphics drivers during the task sequence.

Note, in some cases the crashing application may report via WER (windows error report) popup. If you examine the details, you may note that the fault module name contains a stackhash code a7aa, which is often a indicator that the issue is likely related to a driver issue for the video subsystem:

SNAGHTML31458dc0


*Oddly enough, I could not reproduce the issue when connected remotely using RDP. This should have been a clear indicator as to what the issue really was because RDP does not use the host system’s graphics drivers but those of the connecting system instead. 

Posted in Troubleshooting, Troubleshooting Tools | Tagged: , , | Leave a Comment »

The Case of My Broken App in Windows 8

Posted by William Diaz on August 1, 2014


This is a case where the Application Event logs came in handy when my application started to crash upon loading on our Windows 8.1 images. Since my app was compiled as .NET, the stack in the error details pointed me to problem object:

image

When TextBlock3 loaded it was doing Environment.GetEnvironmentVariable(“SomeVariable”). The variable in question did not exist on our Windows 8.1 images. Although this did not seem to pose an issue for my Windows 7 dev box (it just would not display the TextBlock), Windows 8 will throw an exception if the variable does not exist and the app will crash. The likely cause my dev PC did not encounter this exception when running was because .NET framework 4.5 was not installed whereas .NET 4.5 is the default framework in Windows 8.

Posted in Troubleshooting | Tagged: | Leave a Comment »

The Case of the Ghost Files in IE

Posted by William Diaz on January 24, 2014


While in the process of composing an web-based email today via Internet Explorer, I noticed something odd when I went to attach a file to the message. In the IE file upload dialog there were a series of files listed on the desktop that I knew were not really there. Judging by the dates they had been hanging around for some time now but I had never noticed them (and, no, they were not hidden or marked as protected operating system files):

SNAGHTML1303b167

The files themselves were no mystery; they are nothing more than text files that dump process, thread, and stack information to the desktop when the JRE crashes. I tried to attach one of these to the web message but nothing would happen. However, from within in the dialog box I could right click and open them like any other files. Attempting to move the file also failed because the file itself apparently didn’t exist:

SNAGHTML1319e5a1

If that was the case, I should then get the same message trying to copy it back to the desktop. Instead, the dialog this time indicated it did exist:

SNAGHTML131cc2f5

I wondered if I could access these ghost files from outside IE by, for example, attaching them to a message in Outlook. Not surprisingly, the same set of files did not appear from the desktop location:

SNAGHTML132052f4

This was likely something specific to IE. To determine where the files were actually residing, I turned to Process Monitor, started a trace for file activity and proceeded to open one of the ghost files via the IE File upload dialog box. Afterwards, I stopped the trace and did a search for the file in question.

image

There was half the mystery, the files actually resided in C:\Users\username\AppData\Local\Microsoft\Windows\Temporary Internet Files\Virtualized\C\Users\username\Desktop. The other half of the mystery was then just a matter of some quick research into IE and Virtualized folders. That lead me to this MSDN article Understanding and Working in Protected Mode Internet Explorer. In short:

A Compatibility Layer handles the needs of many existing extensions. It intercepts attempts to write to medium integrity resources, such as the Documents folder in the user profile and the HKEY_CURRENT_USER registry hive. However it will not intercept writes to system locations like Program Files and HKEY_LOCAL_MACHINE. The compatibility layer uses a Windows Compatibility Shim to automatically redirect these operations to the following low integrity locations:

  • Documents and Settings\%userprofile%\LocalSettings\TemporaryInternet Files\Virtualized (pre-Vista)

If I unchecked Enable Protected Mode in IE the virtual files no longer appeared in the file IE file dialog. Not that you don’t want to do that, just delete the files instead.

Posted in Troubleshooting | Tagged: | Leave a Comment »