
The Case of the Random Internet Explorer Crashes
Posted by William Diaz on July 2, 2010
Some time ago we started to see a rash of complaints where Internet Explorer was crashing while visiting certain sites. Even though we were still largely a mix of IE6 and IE7, I had no problem reproducing the crash with IE8. The error message was rather vague (they often are) and didn’t offer any details as to what was the cause or how to troubleshoot: "IEXPLORE.EXE – Application Error – The Instruction at … referenced memory at … The memory could not be ‘read’": 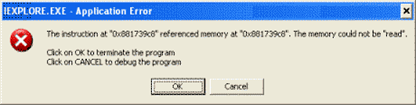
In other cases, the error encountered was different but still just as vague: “Microsoft Visual C++ Runtime Library – Runtime Error! … R6025 – pure virtual function call" 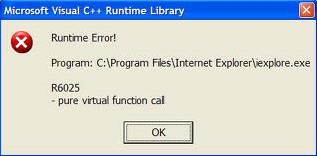
Initial troubleshooting first meant finding a site that would consistently crash IE, and I soon I noticed a trend: web pages that were heavy on Adobe Flash content seemed to be part of the problem, mostly online news websites, and specifically nytimes.com virtually all of the time. With that, working around the issue was rather simple, avoid the problem sites or disable the Adobe Flash component in IE (in IE this is known as the Shockwave Flash Object). Simple but not practical. Try browsing the web with Flash disabled or telling users in our NY office not to visit nytimes. Another approach was to update to latest Adobe Flash Player offering. When this didn’t work, I tried several older versions, but to no avail.
Early in the troubleshooting process I always peer into the Windows Event Viewer to look for clues before going deeper. It was here where I noticed that a network component/protocol driver might be involved, specifically the Windows Proxy Client. Each time IE crashed, the following event was logged: “Application [iexplore.exe]. Authentication was rejected by the WinSock Proxy Server. Check the credentials for the account that is used for the process." 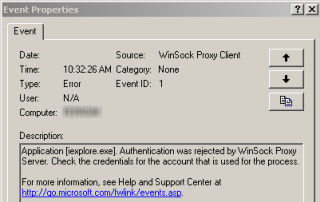
Additionally, I noticed in the system tray that the Windows ISA Firewall Client would indicate a failed authentication: 
This was my first time troubleshooting a firewall service and admittedly I didn’t know where to begin. Out of desperation, I tried resetting the winsock catalog (cmd > netsh winsock reset catalog). Amazingly, the problem disappeared. And soon I would discover why: a couple days later the test workstation I was using for this project was not able to send software faxes. The fax software relied on the Firewall Client for ISA to transmit. When you run a reset of the winsock catalog, you remove the Base Service Providers that are not already included with Windows, i.e. it ended up removing the BSP for the Microsoft Firewall Client for ISA (otherwise known as the Microsoft Firewall Client Service Provider). If the FWC icon is present in the System Tray, there is sometimes a visual queue that your FWC is no longer functioning properly by the presence of a yellow exclamation over the icon. Since our workstations cannot do without the FWC, I reinstalled it, and with BSPs for the FWC once again in place, the crashing behavior in IE returned1.
My next approach was to see if I could isolate the component or driver that was causing IE to crash. I went to C:\Documents and Settings\All Users\Application Data\Microsoft\Dr Watson and opened the drwatson32.log file. The file is written to each time the Dr. Watson (otherwise known as the Windows XP post mortem debugger) captures the output of a user-mode crash. User-mode is just another term for an application or service. The system state, various application threads and stacks information are logged here as plain text and can be quickly analyzed to gather important clues on what module was involved in the crash. The log provides a good means of tracking a history of persistent problems and spotting common traits among crashing processes. Newest information is written to the end of the log, and thread and stack information is read from the bottom to the top. There is a lot of information here that looks cryptic, but once you know what you are looking for its easy enough to identify what you are looking for. See this MS TechNet blog for more details on how to interpret these logs.
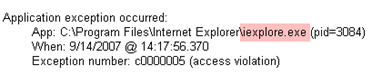
To start, check to see if the crash was captured: from the bottom of the log Ctrl+F and search for the word application going up. iexplore.exe is the crashing process. Verify by the time stamp that this coincides with the time of crash. You can also see the type of exception, e.g. an access violation in this case, where a program tries to access a part of memory it does not have access to (these are the most common types).
Now search for FAULT going down (check the Upper Case option). Ideally, the FAULT is where we encounter the problem module (usually a .dll or .sys file). If symbols are available, you will see the function in the stack of the problem thread, otherwise you will encounter some hexadecimal string in its place. In the case here, we are dealing with a security component and/or a component that is not part of the Windows out-of-the-box experience so it doesn’t surprise me that the function is not available (you also encounter this with 3rd party modules for which symbols are not usually available):
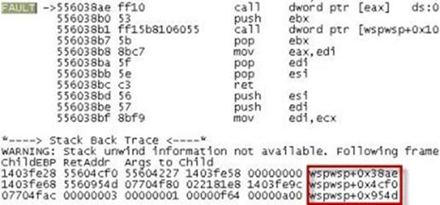
After pouring through several drwtsn32.logs, the common pattern in all the crashes was the presence of wspwsp. A little research reveals this is the WinSockProxy WS2.0 provider DLL that belongs to the Windows ISA firewall client. I was a little surprised by this because statistically 3rd party drivers are usually the cause, not Microsoft. This, coupled with the Event Viewer logs I saw earlier, meant that the likely culprit was, in fact, the FWC.
The first, and most obvious, path was to see if the FWC needed updating. The version of the FWC we were running was already a few years old and since then a new FWC for ISA had been released. I removed the old FWC on a few workstations, installed the latest offering from Microsoft, and the crashing behavior no longer occurred. Eventually, the latest FWC offering was pushed out to all the workstations and we no longer saw the issue.
In addition to the drwtsn32.log, the post mortem debugger generates a user mode dump in the form of a file called user.dmp2 in the same location. Unlike the plain text log, it requires WinDbg from the Windows Debugging Tools to be opened. In short, WinDbg employs heuristics to attempt to identify the cause of a user mode crash. Upon opening the dump, use the !analyze –v command (!=BANG) to start an analysis:
|
STACK_TEXT: SYMBOL_STACK_INDEX: 2 SYMBOL_NAME: WSPWSP+817a FOLLOWUP_NAME: MachineOwner MODULE_NAME: WSPWSP IMAGE_NAME: WSPWSP.DLL DEBUG_FLR_IMAGE_TIMESTAMP: 408b776a STACK_COMMAND: ~18s; .ecxr ; kb |
You can see how the stack is similar to the drwtsn32.log. Clicking the module name hyperlink performs the lmvm command, which provides the details for the module:
|
0:018> lmvm WSPWSP |
Since !analyze –v is heuristics based, it might be worthwhile examining the problem thread in detail for clues to 3rd party modules as well or for more symbolic stack information. Start by dumping all the threads using the ~*kb command and find the thread with module identified heuristically. In this case, thread 33 looks like a match:
|
0:033> kb |
Starting the from bottom working our way up, you can see our original suspect component, Adobe Flash, enters the picture, followed by various functions being called in ws2_32.dll (Win Socket 2.0) before passing into the firewall client (wspwsp.dll) before the thread comes to an end.
Taking it a step further, you can dump the 3rd parameter of the FWC module to reveal what was happening before IE crashed:
|
0:033> da 00d83bd0 |
Sure enough, nytimes.com is where IE kept crashing.
A good strategy when dealing with larger stacks is to start by looking for 3rd party components or Microsoft components that are installed after Windows. Knowing that threads\stacks read from bottom to top, you can then sort of surmise that Flash is is involved but as we move up to the current examine thread that wspwsp.dll plays a role:
Some common commands to employ in WinDbg to assist you:
~*k – view all threads with stacks.
lmvm ComponentName – get info on the component in question (List Modules Verbose Match, I believe): 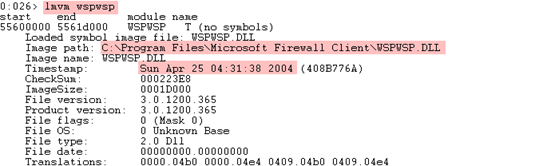
Check the timestamp for old components that may have updates. This component was actually last modified in 2004 but dates back further: 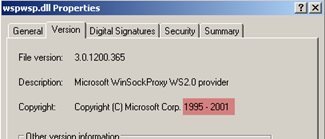
Since upgrading, wspwsp.dll has been replaced by FwcWsp.dll, dated 2006: 
!gle or !gle –all – Get Last Error of the current examine thread or all errors from all threads:
|
Last error for thread 8: Last error for thread 9: Last error for thread a: Last error for thread b: Last error for thread c: Last error for thread d: Last error for thread e: Last error for thread f: Last error for thread 10: Last error for thread 11: Last error for thread 12: Last error for thread 13: Last error for thread 14: |
Note that the output above lists threads in there hexadecimal format, hence why we go from 1-9, then a-f (10-15), then 10-19 (16-25), and so on.
~33s – Change context to thread 33.
Learning to troubleshoot by understanding how to read drwtsn32.logs and using WinDbg opens up a whole new dimension when dealing with the cases of the unexplained.
1 Resetting the BSP did, however, point to a more suitable workaround, which was to instruct users to disable the firewall client while browsing the web since IE was already configured to use a proxy and did not rely on the FWC to handle Internet traffic.
2 I had also filed a bug report with Adobe earlier and while investigating from this angle I discovered another method for capturing Flash related application crashes. For Windows XP, this can be done by going to C:\windows\system32\macromed\flash and opening (or creating the file if not present) mms.cfg with notepad and add the following text: CrashLogEnable=1. The next time Flash Player crashes IE (or any browser for that matter) a minidump will be produced in C:\Documents and Settings\username\Local Settings\Temp named player_crash_log(#).mdmp.

You Might Have Resolved that Networking Issue Because You Unknowingly Broke Your Firewall (but also isolated the cause) « Windows Explored said
[…] a problem with the LSP application. I encountered this myself way back in my first blog post of the The Case of the Random Internet Explorer Crashes. Share this:EmailPrintDiggFacebookTwitterLinkedInRedditStumbleUponLike this:LikeBe the first to […]