
Another Instance of Internet Explorer Crashing (or Update Your IE Add-Ons)
Posted by William Diaz on October 13, 2010
It doesn’t surprise me when Internet Explorer crashes. Instead, I remain calm and collected (most of the time). I don’t expect the average person to know why or how it happened and I expect them to take the opposite approach and be fed up with IE. But with everything that’s happening with the endless number of add-ons that it needs to support and the dynamic nature of web content, it’s amazing it works more often than not. So, here I was asked to explore the latest case of IE crashing. Our user has logged into an online document collaboration site. They need to open and print several dozen documents. About half the time, the client is interrupted by the following error before IE crashes: “Microsoft Visual C++ Runtime Library. Runtime Error!.. iexplore.exe. abnormal program termination”

The reliable DrWatson fails to capture the fault error in either log or produce a user-mode dump when IE crashes. We need to manually attach some debugger to Internet Explorer to get a dump … or we can use Process Explorer, since the error prompt precedes ending the iexplore.exe process, which means it can be right-clicked on and dumped from there. I copy and open the dump to my workstation which already has the Windows Debugging Tools installed and open with WinDbg. It points to a “false-positive”, which is just another way of saying that the WinDbg heuristics engine cannot specify the cause:
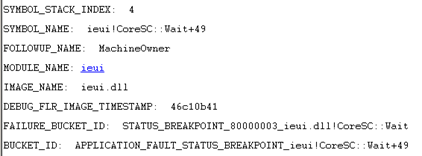
Viewing the stack produced by !analyze -v, we don’t see any signs of 3rd party components:

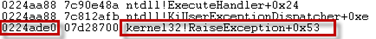
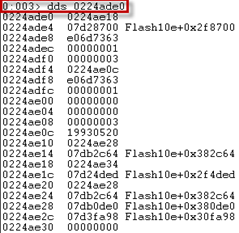
Now we need to look inside the memory address of kernel32 where the exception is raised. To do this, use the dds command in WinDbg (dqs for 64 bit). Most of the time, what we are looking for is some 3rd party component:
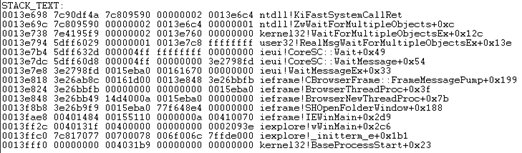
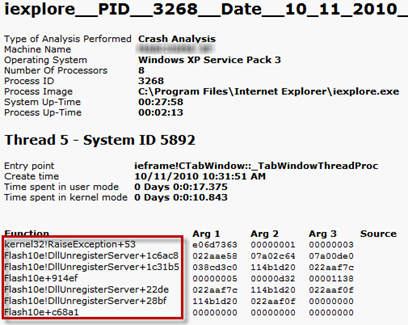
Alternatively, you can see more of the stack by switching to the context of that thread by typing ~3s. Follow with the k command to reveal the Flash component encountered right before the exception:

It turns out that the on-line document collaboration site uses Flash Player for opening and displaying documents.
Alternatively, another method of dump analysis that can be done on the user’s workstation without the need for WinDbg, is to install the Debug Diagnostics tool from Microsoft and set a crash rule for iexplore.exe. Afterwards, it can run a dump analysis from the GUI. Here, we also see signs of the problem add-on in IE:
When a 3rd party component is identified in a dump, the first attempt to resolve is to look for an update, which in this case involved upgrading to latest version of Flash Player, which resolved the problem. By the way, flash component names use letters to denote versions, e.g. Flash10e, Flash10f, Flash10g.

Leave a comment