
An Oldie But Still A Goodie–Dr. Watson
Posted by William Diaz on October 3, 2011
A few years ago I started to see several complaints of Internet Explorer crashing in the course of a couple months. The error was one of the rather vague exception messages thrown at the time of the crash and didn’t allude to anything obvious. Tired of not being able to explain through any of the conventional troubleshooting methods, I did a little research into advanced troubleshooting techniques and came across the Windows XP default debugger, Dr. Watson. Sure it sounds a little cheesy but this is actually a helpful little gem that has assisted me in resolving many cases of unexplained application crashes. And even though Microsoft has done away with drwtsn32.exe in all Windows operating systems after XP, the majority of small and large enterprises are still using XP, which means it should be one of core tools of any Windows XP troubleshooting guru. You’ll also see how, despite Microsoft moving to WER, Dr. Watson can still be leveraged by the Windows Vista/7 OS (just for the hell of it).
To use Dr. Watson, you don’t need to do anything. By default, it is the default Windows XP debugger. When an application experiences a exception of sorts that leads to a crash, ideally it is designed to dump that process and create two files, a plain text drwtsn32.log and a dump file named user.dmp, the latter which requires WinDbg to open and analyze. If you are not sure if Dr. Watson is the default debugger, you can run drwtsn32.exe –i to make it the default. You can also confirm by going to HKLM\Software\Microsoft\Windows NT\CurrentVersion\AeDebug and looking in the Debugger string for drwtsn32 -p %ld -e %ld –g:

To access the Dr. Watson UI, run drwtsn32:

The UI is pretty much self explanatory. By default, log and dump files are written to C:\Documents and Settings\All Users\Application Data\Microsoft\Dr Watson. You can view the log of the current exception from the UI or open the log itself, which is appended to each time Watson captures an exception, with the most current exception text added to the end the log. I am often interested in establishing a pattern or history of application crashes so I prefer to look at the drwtsn32.log as not all application crashes are reproducible and its not uncommon to run across a random, one time exceptions. Opening the log in Notepad also provides the benefit of using the search feature since you are usually looking for a couple key search words to expedite your analysis.
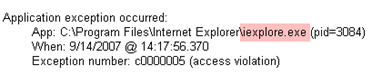
Reading a drwtsn32.log starts by scrolling to the end of the log. From here, search up for the word “application” to confirm the time stamp and application that is crashing.
Everything below this is basically snapshot of the system, all the running processes and loaded modules. I usually skip this and proceed directly to searching “FAULT” down in the log (check the Match case option) to get to the point. From here I take a look at the stack back trace
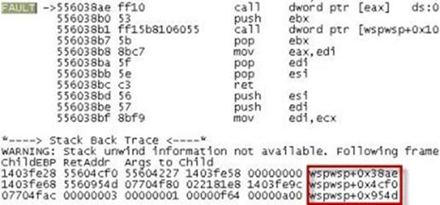
You don’t need to be a programmer to make sense of this. The simple approach is to look at the stack for some common culprit, usually third party or something not part of the Windows out-of-box experience. In the case above, wspwsp.dll, a component of the firewall client for ISA, was a common theme in all instances IE crashing on various websites and upgrading the firewall client on all the company workstations resolved the issue.
Here is another example, where IE was again crashing when trying to print from a certain website. The stack is read from the bottom to the top.

In this case, we have a Windows module, USER32, calling into IEFRAME, which eventually calls into a 3rd party toolbar (LNToolBar) in IE that further calls into another component that is also part of the same application. Disabling the IE toolbar add-on worked around the problem. Ideally, the software developer should be contacted once an issue like this has been identified so they can further examine and possibly correct.
When viewing drwtsn32 logs, don’t worry about the hexadecimal junk after the module names or “Following frames may be wrong” text. You are often not going to be able to see functions within 3rd party modules, security components, or some Windows components that are not part of the Windows out-of-box experience, e.g. Office, as the system may not have access to the corresponding pdb files.
Exception handling Post XP
With Vista and going forward, Microsoft no longer offers application exception handling out of box. Instead, Microsoft uses Windows Error Reporting. This is not to say that you cannot configure user mode exception handling. Via a registry edit, this can be done, and I already covered it here or see this MSDN page: http://msdn.microsoft.com/en-us/library/bb787181(VS.85).aspx. Alternatively, you can install WinDbg and configure it as the default debugger; the same goes for Visual Studio.
Just for the hell of it – Dr. Watson32 in Windows Vista/7?
Curious to see if it could be done, I opened a Windows XP virtual machine on my Windows 7 workstation and copied drwtsn32.exe from the system32 folder. From an elevated command prompt I ran drwtsn32 –i.

Looking at the registry, we see the appropriate change, although this is a 64 bit OS so the registry change is reflected in HKLM\Software\Wow6432Node.

Of course, the moment of truth would require us crashing something. We still happen to have a buggy IE add-on so I installed it, opened IE, and two clicks later crashed IE with first promising result:

Second promising result, the drwtsn32.log and user.dmp:

And last promising result, the culprit revealed:


It should be noted that drwtsn32 is 32 bit. It won’t handle 64 bit user mode exceptions. And the reality is that as much as a Watson enthusiast Windows XP made me, I only did this experiment just to see if it would work. I have since made the Windows 7 jump at work and soon so will the rest of the company, and I will be using crash dump archiving, WinDbg, ADPlus, & Debug Diagnostics.
The Doctor will be retiring.

Leave a comment